Fox News Democracy 2022
2022 Nevada Election Results
Population 3,030,281 Est. Registered Voters 2,153,391
Senate
Voters in Nevada are electing one member to the U.S. Senate.
Results

D
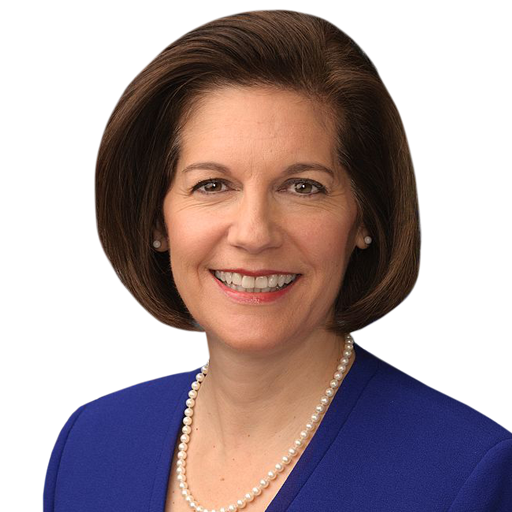
Cortez Masto
Catherine Cortez Masto
493,443
48.88%

R
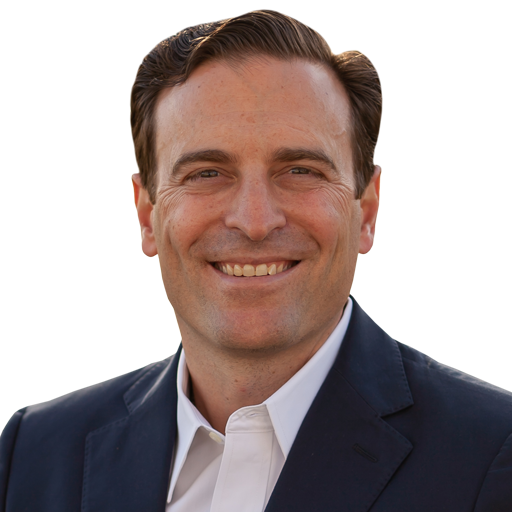
Laxalt
Adam Laxalt
484,436
47.99%

O
None of these candidates
None of these candidates
12,217
1.21%

O
Lindemann
Barry Lindemann
7,936
0.79%

O
Scott
Neil Scott
6,321
0.63%

O
Rubinson
Barry Rubinson
5,125
0.51%

D
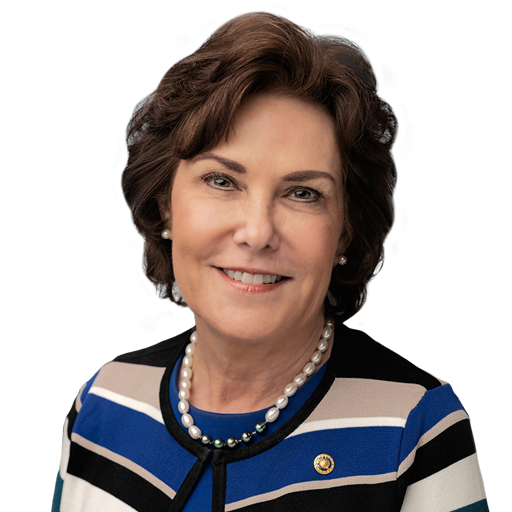
Jacky Rosen
Term ending 2024
Term ending 2024
House
Voters are electing candidates to serve in the U.S. House from each of the state's districts.
Results
01
Titus
+5.63
02
Amodei
+21.86
03
Lee
+4.04
04
Horsford
+4.88
Governor
Voters are electing a candidate to serve as governor.
Results

R
Lombardo
Joe Lombardo
491,314
48.76%

D
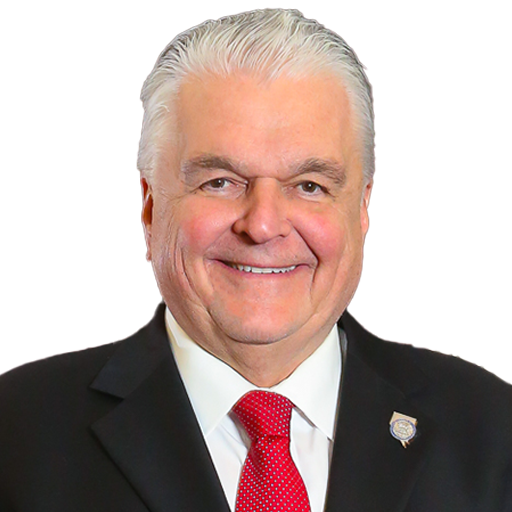
Sisolak
Steve Sisolak
477,349
47.37%

O
Davis
Brandon Davis
14,663
1.46%

O
None of these candidates
None of these candidates
14,620
1.45%

O
Bridges
Ed Bridges
9,761
0.97%
Senate Results
| Candidates | Votes | % |
|---|
Nevada |
||||
|---|---|---|---|---|
D
Cortez MastoCatherine Cortez MastoIn |
|
493,443 | 48.88% | |
R
LaxaltAdam Laxalt |
|
484,436 | 47.99% | |
O
None of these candidatesNone of these candidates |
|
12,217 | 1.21% | |
O
LindemannBarry Lindemann |
|
7,936 | <1% | |
O
ScottNeil Scott |
|
6,321 | <1% | |
O
RubinsonBarry Rubinson |
|
5,125 | <1% | |
| CLOSED Polls are closed Reporting 98.89% in | ||||
Results by County
| Candidates | Votes | % |
|---|
|
Carson City
|
||||
|---|---|---|---|---|
| R Laxalt Adam Laxalt |
|
12,451 | 52.55% | |
| D Cortez Masto Catherine Cortez Masto In |
|
10,337 | 43.63% | |
| O None of these candidates None of these candidates |
|
308 | 1.30% | |
| O Lindemann Barry Lindemann |
|
234 | <1% | |
| O Rubinson Barry Rubinson |
|
189 | <1% | |
| O Scott Neil Scott |
|
175 | <1% | |
| CLOSED Polls are closed Reporting 100% in | ||||
| Candidates | Votes | % |
|---|
| Candidates | Votes | % |
|---|
| Candidates | Votes | % |
|---|
| Candidates | Votes | % |
|---|
| Candidates | Votes | % |
|---|
| Candidates | Votes | % |
|---|
| Candidates | Votes | % |
|---|
| Candidates | Votes | % |
|---|
| Candidates | Votes | % |
|---|
| Candidates | Votes | % |
|---|
| Candidates | Votes | % |
|---|
| Candidates | Votes | % |
|---|
| Candidates | Votes | % |
|---|
| Candidates | Votes | % |
|---|
| Candidates | Votes | % |
|---|
| Candidates | Votes | % |
|---|
House of Reps. Results
3
Dems
Democrats
1
Reps
Republicans
-
Ind
Independents
NV
01
01
NV
02
02
NV
03
03
NV
04
04
Results by District
| Candidates | Votes | % |
|---|
NV 01 |
||||
|---|---|---|---|---|
D
TitusDina TitusIn |
|
114,916 | 51.58% | |
R
RobertsonMark Robertson |
|
102,355 | 45.95% | |
O
CavanaughKen Cavanaugh |
|
5,502 | 2.47% | |
| CLOSED Polls are closed Reporting 99.3% in | ||||
Governor Results
| Candidates | Votes | % |
|---|
Nevada |
||||
|---|---|---|---|---|
R
LombardoJoe Lombardo |
|
491,314 | 48.76% | |
D
SisolakSteve SisolakIn |
|
477,349 | 47.37% | |
O
DavisBrandon Davis |
|
14,663 | 1.46% | |
O
None of these candidatesNone of these candidates |
|
14,620 | 1.45% | |
O
BridgesEd Bridges |
|
9,761 | <1% | |
| CLOSED Polls are closed Reporting 98.88% in | ||||
Results by County
| Candidates | Votes | % |
|---|
|
Carson City
|
||||
|---|---|---|---|---|
| R Lombardo Joe Lombardo |
|
12,721 | 53.75% | |
| D Sisolak Steve Sisolak In |
|
9,822 | 41.50% | |
| O None of these candidates None of these candidates |
|
428 | 1.81% | |
| O Davis Brandon Davis |
|
402 | 1.70% | |
| O Bridges Ed Bridges |
|
292 | 1.23% | |
| CLOSED Polls are closed Reporting 100% in | ||||
| Candidates | Votes | % |
|---|
| Candidates | Votes | % |
|---|
| Candidates | Votes | % |
|---|
| Candidates | Votes | % |
|---|
| Candidates | Votes | % |
|---|
| Candidates | Votes | % |
|---|
| Candidates | Votes | % |
|---|
| Candidates | Votes | % |
|---|
| Candidates | Votes | % |
|---|
| Candidates | Votes | % |
|---|
| Candidates | Votes | % |
|---|
| Candidates | Votes | % |
|---|
| Candidates | Votes | % |
|---|
| Candidates | Votes | % |
|---|
| Candidates | Votes | % |
|---|
| Candidates | Votes | % |
|---|
Ballot Measures
2 - Raise Min Wage to $12Yes |
||
|---|---|---|
| Yes | 539,661 | 55.17% |
| No | 438,497 | 44.83% |
| CLOSED Polls are closed Reporting 98.99% in | ||
1 - Equal Rights AmendmentYes |
||
|---|---|---|
| Yes | 573,548 | 58.63% |
| No | 404,727 | 41.37% |
| CLOSED Polls are closed Reporting 98.99% in | ||
3 - Top-5-Pri, Ranked Choice GEYes |
||
|---|---|---|
| Yes | 518,314 | 52.86% |
| No | 462,179 | 47.14% |
| CLOSED Polls are closed Reporting 98.99% in | ||


